
Before kicking off with the actual assignment question that could come your way when you begin or are already pursuing the subject, it is a well-known fact that economics is not a small or a “not-vast” subject. There are a number of complexities that are involved in this subject.
What doesn’t have complexities, right? Let’s just focus on what economics is based on.
Demand and Supply
If you are already at the graduation or postgraduation level, you would be well aware with at least the definitions. However, to only give you a brief about them,
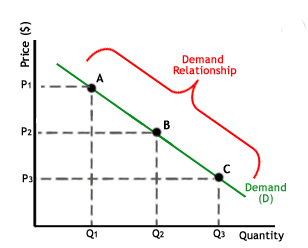
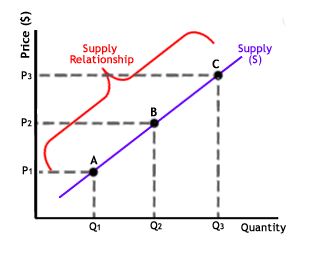
The above is a simple graph that you would relate with demand relationship. Hoping that you did not pass the examinations by malpractices or copying your friend’s answer in the examinations, you shall take the above graph as self-explanatory enough. Here’s something similar for the supply relationship.
We are not writing this blog to define you the basics of demand and supply. During your graduation and postgraduation, you would already know what demand and supply mean. Therefore, we have attached below a list of curves you must know or a better way to put it would be to keep them on your fingertips. They are important for both your examinations and weekly assignments for your semesterly assessments.
Important Demand and Supply Graphs
Here’s a crisp list of graphs that our economics demand and supply experts believe help an aspirant all along his tenure as a student or an employee.
Time vs Supply
Unorthodoxly starting with an example, supposing that the demand of umbrellas suddenly increases due to an unexpected extension in the rainy season. The suppliers may get to giving in harder working hours, prolonged labour and usage of resources. The supplier could either choose to meet the demand or just let it be. In case, he chooses the former approach. Given that the change is long term and the climatic conditions would be altered year-round and the climatic conditions would be impacted throughout the year, this makes a great opportunity for the suppliers to tap it. However, the suppliers will have to change the format of their functioning and facilities.
Since no one can predict time, there is no graphical representation of the graph.
Supply and Demand Relationship
Starting with a similar approach, an example, our economics experts believe that examples are a great way to tell a reader something and make him comprehend that something in a better manner.
Imagine that your favourite band, Greenday? Okay, a huge anticipated single Greenday is releasing an album. The album is out for $20. The company did it forecasting and all and predicted that the people would not pay anything more than $20 for the CDs. Therefore, only ten CDs were produced analysing and keeping in mind the opportunity-cost to be too low. On the contrary, in a parallel space, the ten CDs if demanded by 20 people, this would create a demand for the CDs. Therefore, he quantity will have to rise along with the prices. Only this would allow the demand for the CDs to be met by the supplier.
If the case was reversed, and the CDs produced were more than the people to buy them, the demand, price and supply; all of them would fall.
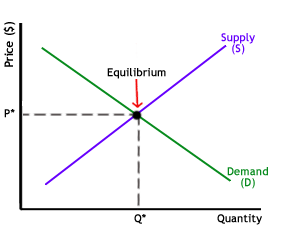
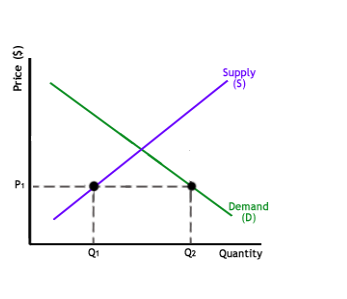
Equilibrium
This is the state, wherein, the supply and demand are equal. Graphically, this happens when the function of demand and the function of supply both intersect. The allocation is very efficient. This happens because all the goods being produced due to the background research are being consumed fully leaving no scope of anyone who goes home hungry. The tummy of everyone in the economy is fully filled.
This is a hypothetical situation, as, in reality, an economic equilibrium between supply and demand cannot possibly exist. This means, that at a given price the suppliers are send ing in the goods (all of them) at the price they want, the retailers or middlemen are getting their desired cuts, and the consumers are not unhappy with the price of the final product they use.

As the above graph clearly states that there is an absolute equilibrium at the intersection. It is point of no inefficiency (allocative). At that moment in the above chart, the price is denoted by (P) and the quantity by (Q).
Disequilibrium
This is when, in the above graph, (P) is not equal to (Q). This happens due to a number of factors. And each of those factors has a graph which could be termed as important for both your end-semesterly examinations and assessments.
Excess Supply
If set prices for goods or services is done high, a surplus of supply would be generated in an economy. In that case and scenario, there shall be allocative inefficiency. This can very well be shown via the graph below.
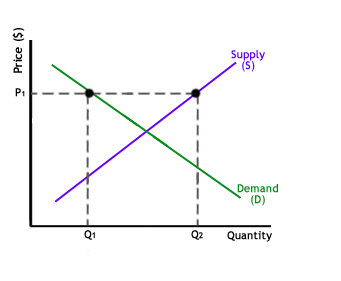
In the graph, you would notice that P1 (quantity of products or goods) that the producers are willingly ready to supply is denoted by Q2. At the time of P1, the required or demanded quantity that is asked by the customers of the suppliers is Q1 which, indeed is much much lesser than Q2. Since, Q1 is lesser than Q2, it means, that there is a surplus of goods available. The quantity being produced is much higher than the demanded consumption.
Excess Demand
Excess Demand is a scenario, wherein, the price is set lesser than the price at equilibrium. Since the price is a bit too less, there’s actually too many producers or suppliers who are not making enough of the goods. The situation can be better understood by the graph below.
As the graph clearly denotes, at Price P1, the total quantity of the goods that the consumers think they want is Q2. The quantity of goods that the suppliers can supply is Q2. Therefore, in the graph, the quantity of goods is too less to meet the demand of the consumers.
Shifts and Movements
The next section or category of graphs is the Shifts and Movements. This is not on earth, related to physics, please! (let physics be out of it. Do not make it more newton-ish complex). Here, by ‘Movement’ we only refer to not ‘the changing price and quantity’ but ‘the change in price and quantity’.
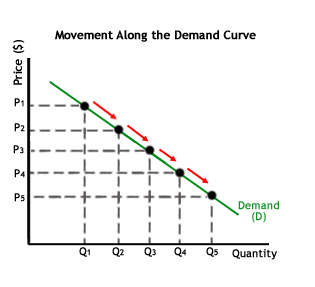
Movement along the Demand Curve
This implicitly means that the demand relationship remains consistent. If you notice, the movement when with or along with the curve of demand occurs when the goods’ demand undergoes a change.
In a layman’s language, the phenomenon of movement occurs whenever there’s a change in the quantity demanded which is influenced or factored only by a price change.
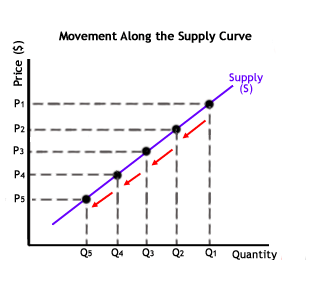
Movement along the Supply Curve
As same as the above in the case of demand curve, movement can also remain consistent along the supply curve. This means that the relationship (supply) remains unchanged. But this ‘no change’ in movement will occur only and only if the goods’ price changes in relation with the changing initial supply relationship. As for movement along the demand curve, it is impacted by a changed price and otherwise as well.
The next comes Shifts. No, we are not going to waste much more of your time (at the same time hoping that the above has been valuable to you. Please, say yes!)
Shifts
Now, the catch in shifts is that the price remains unchanged. So, coming back to the ‘sorta’ definition, the shift occurs. When the quantity of the good (supplied or demanded) experiences a change given that there’s no change in the price. a shift in demand only means that there is a change in the original demand relationship. This implicitly means that there is something that is affecting the quantity demanded and that some thing is other than price.
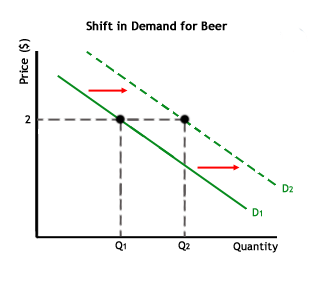
In the above “student friendly” example….
The price of a bottle of beer is kept at $2. There was a decrement in the quantity supplied from Q1 to Q2. There would then be a shift in the total supply or produce of beer. This means, that there is a shift in the supply of beer. Like in case of a shift in the supply curve, and three above has happened or been influenced by a factor other than price. Be it a natural disaster or calamity, but there was generated a shortage of supply.
Phew! That’s whole lot of information up there! How was it! Write to us if you found the above blog useful. And boy, you must keep the above graphs on your fingertips if you wish to be able to show your father your assessment card with pride!
Let’s do it! In case, you need more information about demand supply graphs and all, you are welcome to contact our economics assignment help providing experts and secure for yourself the highest possible grades.